HR software provider Ciphr recently polled 1,031 workers to find out more about their attitudes towards work and how they feel about their current jobs.
On average, around two-thirds (65%) of the people polled said they either loved or liked their current jobs. One in five (20%) said they weren’t bothered either way – selecting the ‘I neither like nor dislike my job’ option – and one in six (16%) admitted to disliking or even hating their jobs.
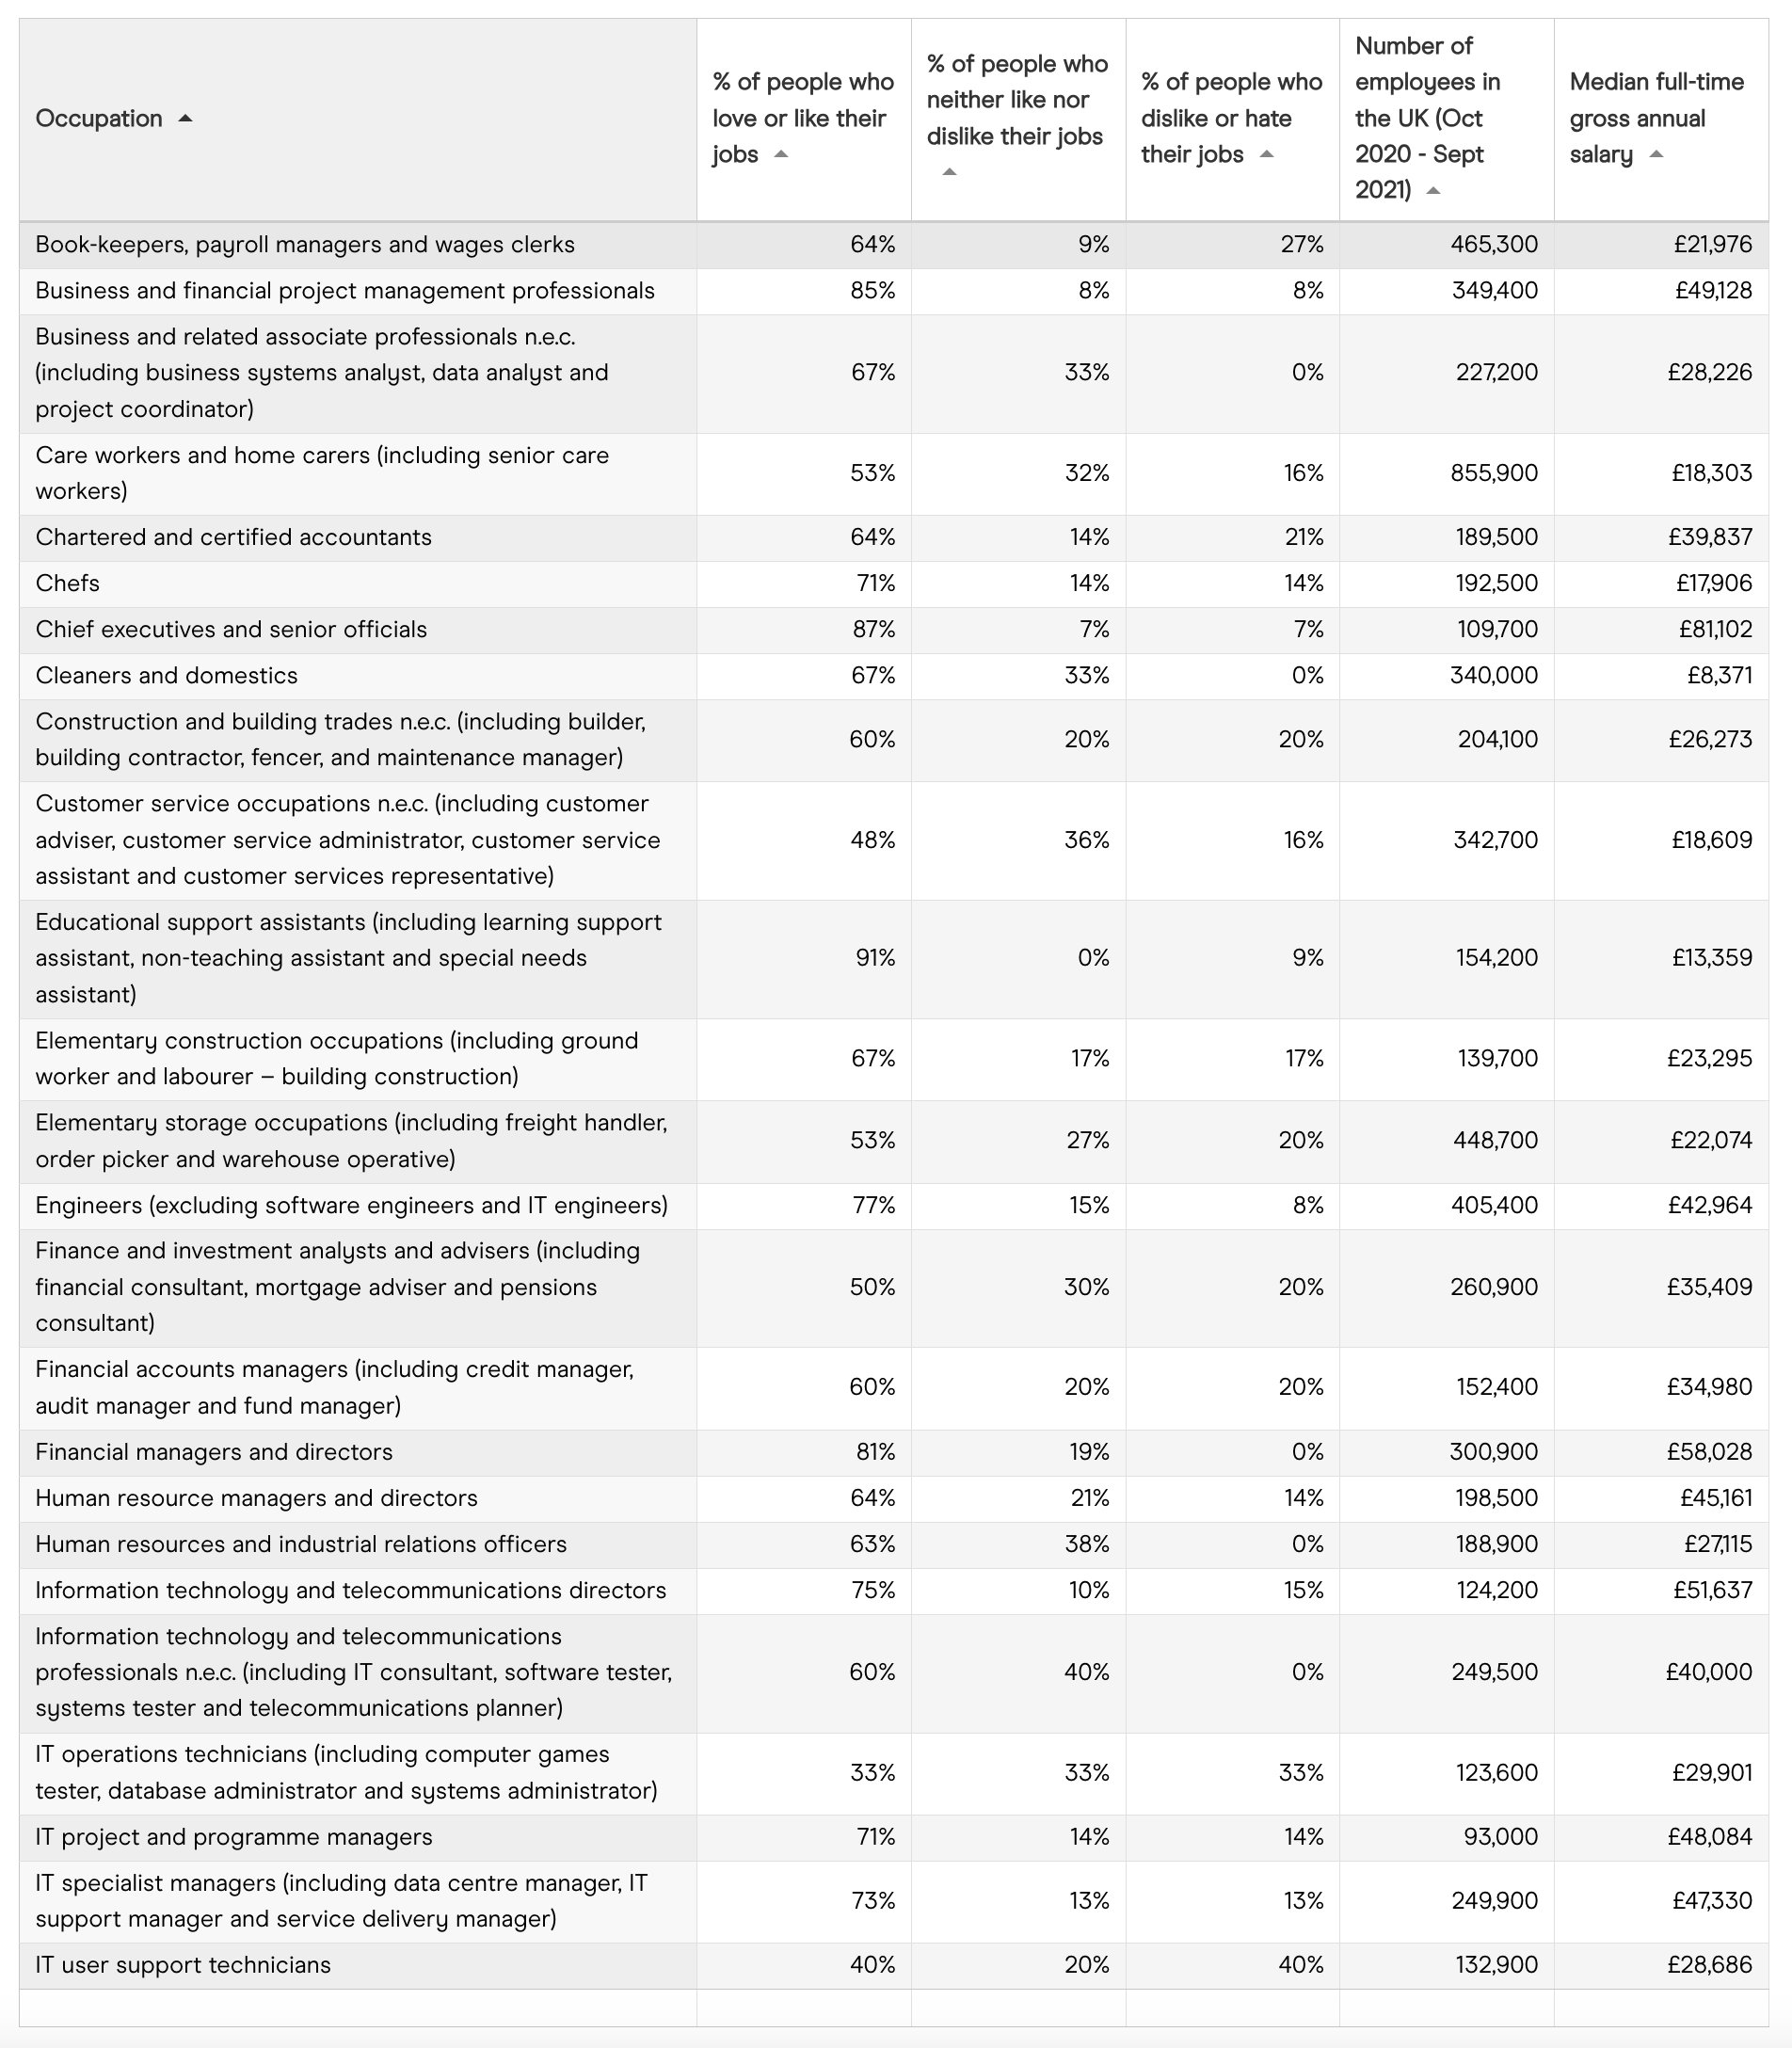
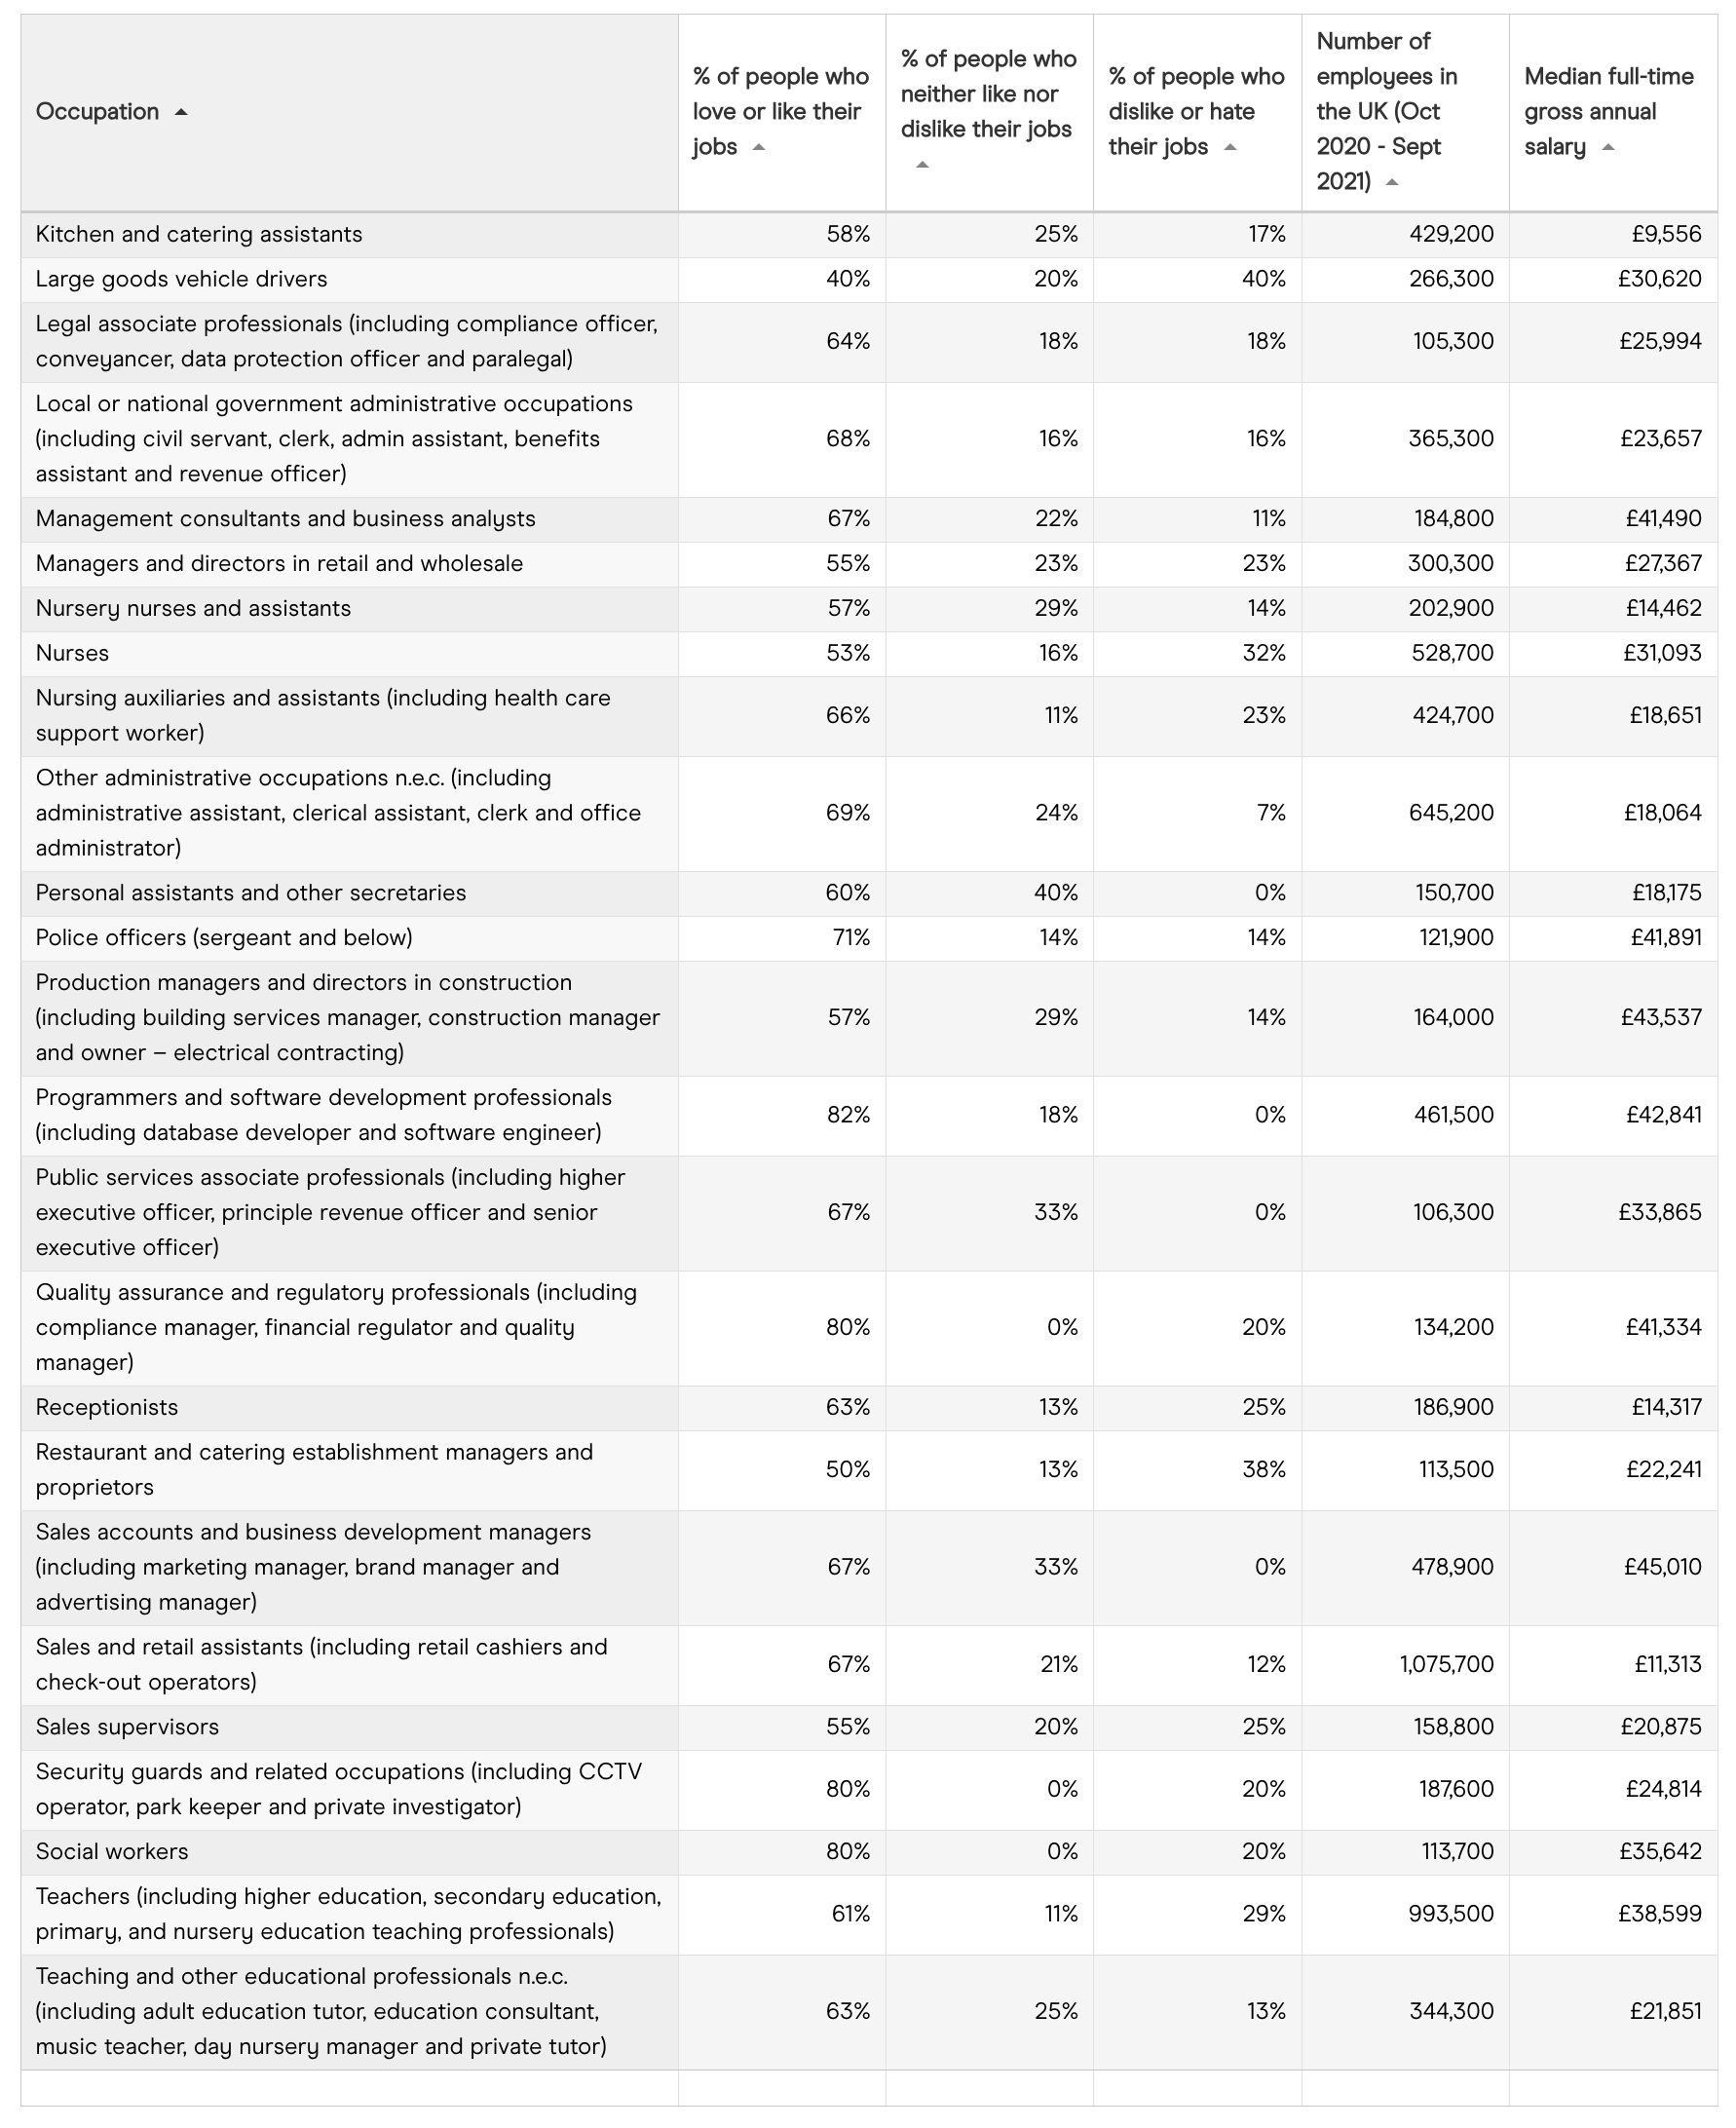
Ciphr took the findings and grouped people with related job titles together (using the Office for National Statistics’ standard occupational classifications) to compile a list of the UK’s best-loved – and also least-liked – occupations. Here’s the results:
How people feel about their current jobs, by occupation


Notably, higher salaried roles do seem to equate to higher job approval overall, statistically at least. Survey respondents earning over £45,000 were twice as likely to say that they love their jobs, compared to people earning under that wage (29% compared to 14%).
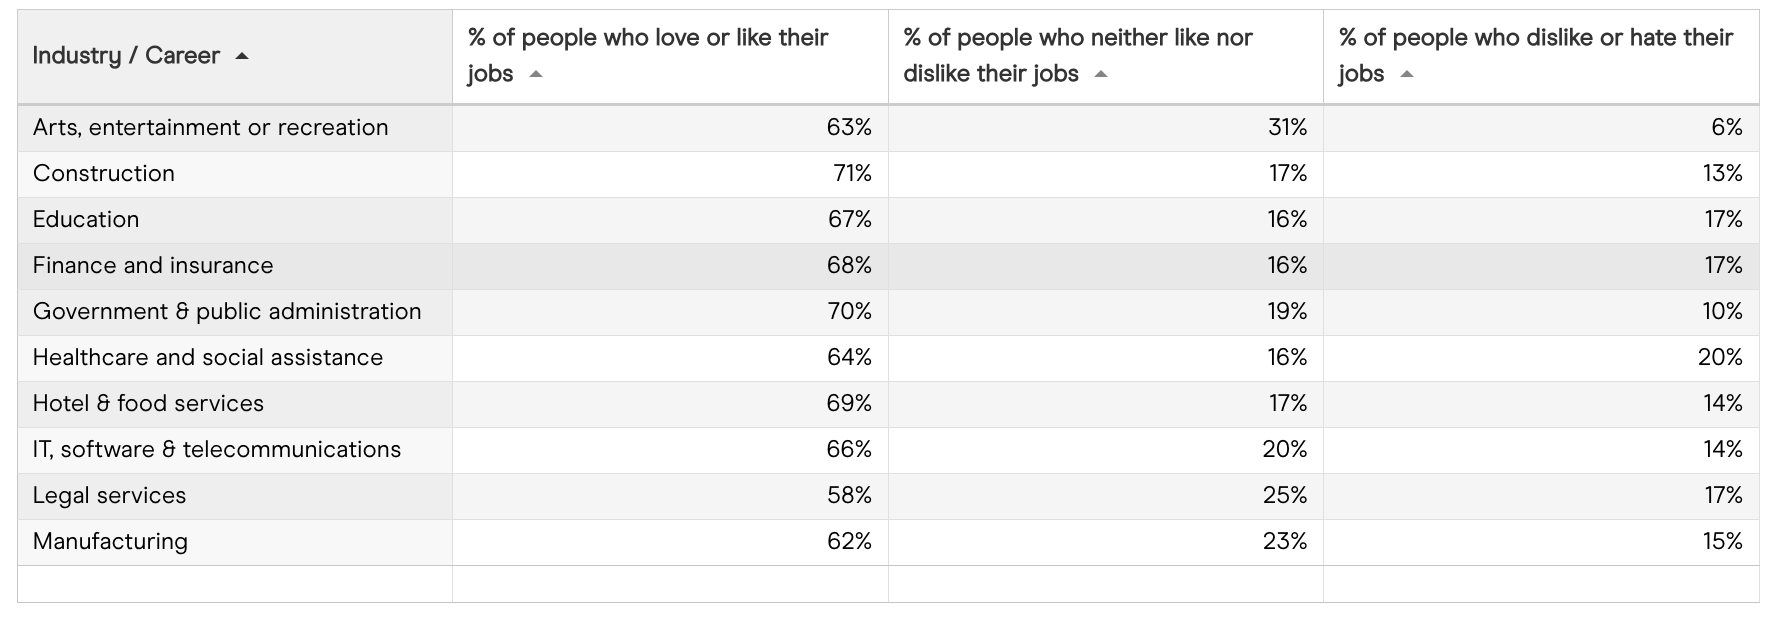
The findings also vary considerably when examined by industry or profession.
How people feel about their current jobs, by industry


Notes
Ciphr polled a representative sample of 1,031 employed British adults in November 2021. 11% of survey respondents work in small companies with 26-50 employees, 28% work in medium-sized companies with 51-250 employees, 23% work in large companies with 251-1,000 employees, 15% work in organisations with 1,001-5,000 employees, and 23% work in enterprises with over 5,001 employees.
All statistics have been rounded to the nearest integer or to one decimal place. Totals may not sum due to rounding.
Due to the survey’s sample size some job titles / industries were underrepresented and therefore too statistically unreliable to include. Most jobs employing over 200,000 people, have been included, however comparable data was not available for the following occupational roles: medical practitioners; van drivers, production managers and directors in manufacturing; IT business analysts, architects and systems designers; electricians and electrical fitters; managers and proprietors in other services n.e.c.; industrial cleaning process occupations; and marketing and sales directors.
All external data sourced from the Office for National Statistics (ONS):
- NOMIS – Annual Population Survey – Employment by occupation by sex (online dataset: Oct 2020 – Sep 2021): https://www.nomisweb.co.uk/datasets/aps168/reports/employment-by-occupation?compare=K02000001
- ONS Occupation Coding Tool: https://onsdigital.github.io/dp-classification-tools/standard-occupational-classification/ONS_SOC_occupation_coding_tool.html
- SOC2010 volume 2: the structure and coding index: https://www.ons.gov.uk/methodology/classificationsandstandards/standardoccupationalclassificationsoc/soc2010/soc2010volume2thestructureandcodingindex
- Annual Survey of Hours and Earnings: 2021 provisional and 2020 revised results (released on 26 October 2021): https://www.ons.gov.uk/employmentandlabourmarket/peopleinwork/earningsandworkinghours/datasets/occupation4digitsoc2010ashetable14
